[Estimated time to read: 4 minutes]
Deciding how to invest as an international professional can be tricky.
You are from country A and you live in country B...for now at least.
Country A seems an obvious home for your investments.
Home is always home after all.
Then there's country C, the home of your offshore bank account...but what about where you plan to retire?
And the alphabet goes on.
So how should your offshore investment portfolio look? ![]()
Andrew Hallam, best selling finance author and global digital nomad, shares our philosophy of evidence-based investing and that no matter how often you move countries, the most important thing is that you remain invested for the long term and diversify.
Below is his article entitled The Best Bargain Index Funds That Everyone Should Own.
This was originally published in January and explains how he and his wife manage their portfolios as globetrotters.
My wife and I are homeless. For the past 18 months we’ve wandered from Singapore to Mexico, Malaysia, Vietnam, Thailand, Bali, back to Singapore.
Sometimes, our friends ask where we plan to retire.
We don’t know.
And for that reason, our investment portfolios don’t reflect a home country bias. We’re global, so our money is global too. It’s divided based on global capitalization. The U.S. represents about 48 percent of the world’s stock market value, so roughly half of our equity exposure is in a U.S. stock ETF.
The remaining stock component is with international index funds.
Researchers Kalok Chan, Vicentiu Covrig and Lillian Ng say most investors – no matter where they’re from – usually tilt their portfolios towards home country stocks. That makes sense. After all, U.S. retirees won’t get phone bills in Euros or Yen.
But if you don’t own an international stock market index, it’s best to add one now.
According to Vanguard, the average American investor had 27 percent of their equities in foreign stocks at the end of 2013. International stocks add diversification. This reduces volatility over most time periods. Sometimes, it can even juice returns. But I suspect that many Americans have cooled on foreign stocks.
After all, it’s in our DNA to chase what’s hot and shun what’s not.
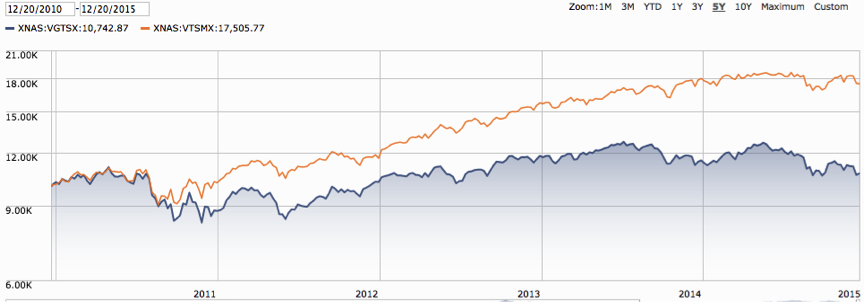
Foreign stock prices, over the past few years, look like they’re frozen. Returns are slim to none.
U.S. stocks, as measured by Vanguard’s Total Stock Market Index (VTSMX), have gained 75 percent.
International stocks (VGTSX) have gained just 10 percent.
Vanguard’s U.S. Total Stock Market Index vs. Vanguard’s International Stock Market Index
December 20, 2010 – December 20th, 2015

Source: Morningstar.com
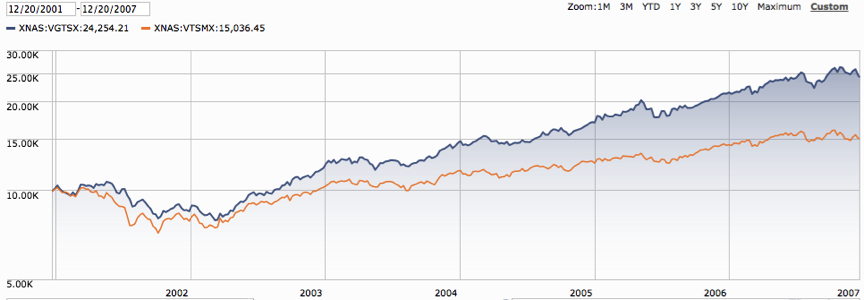
But foreign stocks, at times, leave U.S. stocks behind. They’ll do so again. We just don’t know when. From December 20th, 2001 until December 20th, 2007, Vanguard’s Total U.S. Stock Market Index (VTSMX) gained 50 percent. Vanguard’s International Stock Market Index (VGTSX) made almost three times as much. It gained 142 percent.
Vanguard’s U.S. Total Stock Market Index vs. Vanguard’s International Stock Market Index
December 20, 2001 – December 20th, 2007

Source: Morningstar.com
Winners during one time period are often losers in the next. I’m not saying that foreign stocks will beat U.S. stocks in 2016.
Short-term forecasts are foolish.
Economic Nobel Prize winner, Eugene Fama, says that new information is incorporated into the market so quickly that predicting short-term market moves, with any level of consistency, is almost impossible.
Head of Star Capital Research, Norbert Keimling says, “There is virtually no correlation between the market forecasts for the next year, regularly published at year-end, and the actual performance in that year.”
But U.S. stocks have danger signs.
American companies paid record dividends last year: a stunning $351 billion. That’s good news. But the trailing dividend yield on Vanguard’s Total Stock Market Index (VTSMX) is just 1.8 percent. A dividend yield is a ratio between dividend payouts and stock prices. Despite record-setting dividends, stocks are priced so high that dividends look low. Vanguard’s International Stock Market Index (VGTSX) yields 2.8 percent.
By comparison, it’s a bargain.
Yale University professor, Robert Shiller, compares stock prices with ten years of real earnings. It’s a tougher yardstick than a typical PE ratio because its level isn’t dramatically affected by an unusual level of earnings in a single year. Shiller found that when stocks trade well above their historical average cyclically-adjusted price earnings, or CAPE, levels, they usually stumble in the decade ahead. Below average CAPE levels often lead to a decade of prosperity.
Joachim Klement, Chief Investment Officer at Wellershoff & Partners Ltd., compares global stock market CAPE levels every quarter. According to his data, the United States is overvalued. Its historical CAPE is 16.4 times earnings. Last quarter, it traded at 22.5 times earnings. That’s 37 percent higher than its historic valuation.
International stocks offer a much better deal. The historical average CAPE level of developed world international stocks is 20.11 times earnings. At 15.72 times earnings, they’re trading at a 22 percent discount. Emerging markets are also cheap. Their historical CAPE level is 15.7. At just 13 times earnings, they’re undervalued by 17 percent.
Again, I’m not predicting that international stocks will win over the next year or two.
Nobody knows.
Odds are high, however, that they’ll stomp U.S. stocks over the next ten years.
If you don’t own an international stock market index, this is a good time to add one.
Andrew Hallam is a Digital Nomad. He’s the author of the bestseller, Millionaire Teacher and The Global Expatriate's Guide to Investing: From Millionaire Teacher to Millionaire Expat.
Thank you to Andrew for allowing us to share his views about international investment on our blog.
- CAPE levels, as of September 30, 2015
- Source: Joachim Klement, Chief Investment Officer at Wellershoff & Partners Ltd., via email to Andrew Hallam
